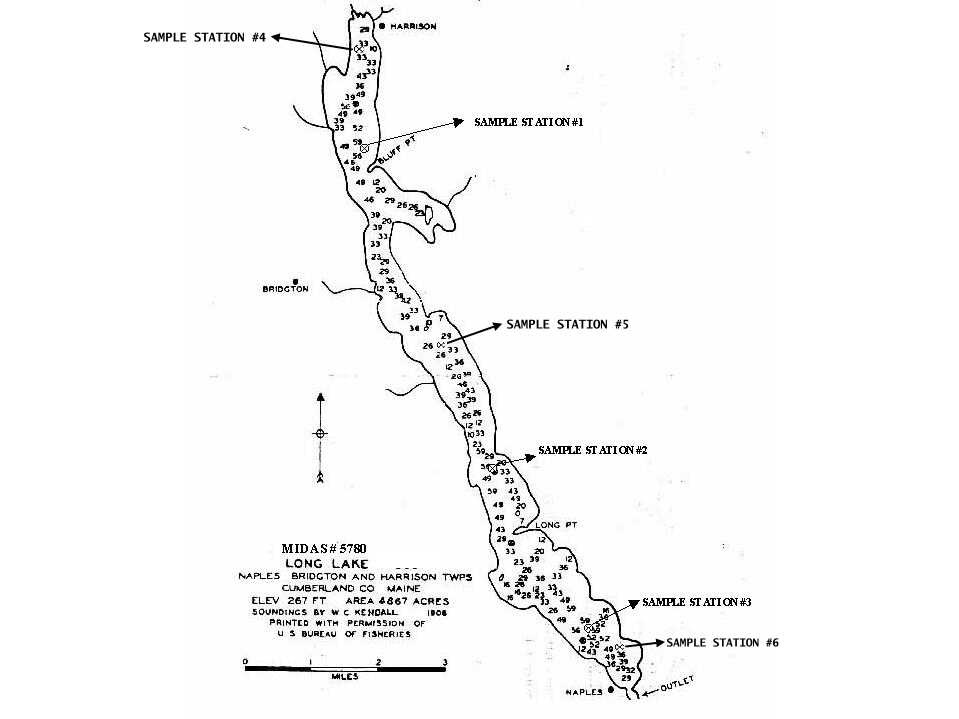
Long Lake

Bridgton, Harrison, Naples, Cumberland, Maine
MIDAS 5780

Secchi transparency (mean, maximum & minimum annual values)

Data and graph may take several seconds to load

Select Station:


Long Lake
MIDAS 5780 - Station 1
Year Depth - Meters Depth - Feet
Min Avg Max Min Avg Max
1976 6.1 6.7 7.3 20.0 22.1 24.0
1977 5 6.3 7 16.4 20.6 23.0
1978 5 5.8 6.5 16.4 19.1 21.3
1979 5 6.8 10.5 16.4 22.5 34.4
1980 5 6.4 7.5 16.4 20.9 24.6
1981 5.5 9.0 12 18.0 29.4 39.4
1982 4.4 6.6 10 14.4 21.7 32.8
1983 3.2 5.1 7.4 10.5 16.8 24.3
1984 3.7 4.7 6 12.1 15.3 19.7
1985 5.9 6.2 6.7 19.4 20.4 22.0
1986 4.6 4.6 4.6 15.1 15.1 15.1
1987 4.6 5.5 6.5 15.1 17.9 21.3
1988 4.5 6.0 8 14.8 19.6 26.2
1989 3.5 5.3 7.8 11.5 17.5 25.6
1990 4.1 5.6 7 13.5 18.2 23.0
1991 5 5.7 6.2 16.4 18.7 20.3
1992 4.5 6.0 7.3 14.8 19.8 24.0
1993 5.2 5.8 7 17.1 19.1 23.0
1994 5.3 6.2 6.8 17.4 20.4 22.3
1995 5.5 6.4 8 18.0 20.9 26.2
1996 4 5.8 7.1 13.1 19.0 23.3
1997 6.1 6.4 7.1 20.0 21.0 23.3
1998 5 5.6 6.2 16.4 18.5 20.3
1999 5.1 6.3 7.9 16.7 20.5 25.9
2000 5 6.2 7.4 16.4 20.3 24.3
2001 4.9 6.8 7.8 16.1 22.3 25.6
2002 5.3 6.5 7.6 17.4 21.2 24.9
2003 5.6 6.5 7.6 18.4 21.3 24.9
2004 5 6.1 6.9 16.4 20.0 22.6
2005 4.7 5.7 7.4 15.4 18.8 24.3
2006 4.6 5.7 6.3 15.1 18.6 20.7
2007 5 5.9 6.8 16.4 19.4 22.3
2008 5.6 6.4 7.4 18.4 21.0 24.3
2009 5 5.7 6.4 16.4 18.7 21.0
2010 5 6.5 7.5 16.4 21.4 24.6
2011 4.4 6.2 8 14.4 20.4 26.2
2012 4.7 5.9 6.9 15.4 19.3 22.6
2013 5.6 6.1 6.7 18.4 20.1 22.0
2014 5 6.1 7.4 16.4 20.0 24.3
2015 5.3 6.6 8.2 17.4 21.6 26.9
2016 5.9 6.9 7.8 19.4 22.6 25.6
2017 5.3 6.0 7 17.4 19.8 23.0
2018 4 6.4 7.5 13.1 21.1 24.6
2019 4.8 5.9 8.6 15.7 19.5 28.2
2020 5.4 5.7 6.1 17.7 18.7 20.0
2021 5 6.2 7.1 16.4 20.4 23.3
2022 4.5 6.5 7.9 14.8 21.2 25.9


Understanding Transparency

Click here for more »


Click for depth map


Source Data:
Maine Lakes Transparency, Color & Chemistry: Annual Mean Values

Date-specific Secchi data for this and other Maine lakes can be found HERE